
Environmental Quality in the Gulf of Maine
|
|
|
|
|
|
|||||||
|
|
|
|
Browse the archive |
|
|
|
|
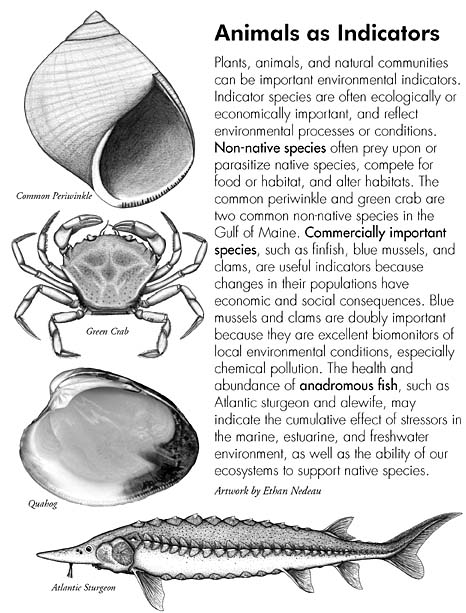
As environmental red flags, indicators reveal marine changes
By Ethan Nedeau
My grandfather, Henry, lives in Kennebunk, Maine, and each morning he walks his dog, Pumpkin, past the house he grew up in. Henry is 78 years old, and he has spent his life as a carpenter and woodworker in Cape Porpoise, Arundel, Kennebunk, and Kennebunkport. He is a true Mainer—from his old dungarees and flannel shirts to his thick accent and hands like driftwood. Henry is not worldly-wise; his experience and perspective are local—rooted in the small community in which he was born, raised and will die. He does not talk much, but his few words are deliberate and heavy with local wisdom. Over the years, Henry has told stories of nearby skating ponds that are now Phragmites marshes, baseball fields that are now housing developments and clambakes with clams that his family dug from nearby tidal flats that have long since been closed because of bacterial contamination.
When it comes to the environment, anecdotal observations abound—strike up a conversation with an old salt and they may share some of their own: ‘winters are not what they once were,’ ‘fishing is not as good as it once was,’ ‘there are no more big trees, and forests are a mere shadow of their former state.’ The lifelong observations of those who have lived for the better part of a century, though often anecdotal, beg the question: how much has the world changed and will it ever be possible to reverse or remedy the decline of its waters, lands and wildlife?
 |
| Click on the picture to enlarge |
One of the most promising approaches to documenting environmental changes is the development of environmental indicators. Indicators are used to describe the status and trends of our natural resources, environmental health and ecological condition. They help raise awareness about important issues, can be used in environmental policy decisions and help evaluate the effectiveness of management actions.
Environmental indicators are similar to many of the economic and social indicators that are ingrained into our culture, such as the Dow Jones Industrial Average. Just as the Dow gives investors a general picture of the state of the market, environmental indicators give scientists and managers a picture of the state of our ecosystems.
Here are some examples of indicators relevant for the Gulf of Maine:
Toxic contamination in shellfish—Mussels and other shellfish are an important commercial resource in the Gulf of Maine and they happen to be excellent indicators of chemical pollution because of their ability to accumulate certain chemicals in their tissue. Thus, it is important to understand toxic contamination in shellfish from both a human health and ecosystem health perspective. The Gulf of Maine Council’s Gulfwatch Monitoring Program uses mussels to monitor chemical contaminants in coastal waters. (To learn more, visit: www.gulfofmaine.org/council, click on Publications).
Nitrogen concentrations in coastal waters—Nitrogen that enters coastal waters, when in excess, can cause a variety of problems such as water quality degradation, habitat loss and harmful algal blooms. Increased nitrogen pollution to coastal waters is often caused by urbanization, residential development, agriculture and other human activities in the watershed. By monitoring nitrogen in coastal waters, researchers can better evaluate the impacts of different activities, assess the threat of more nitrogen pollution and evaluate the effects of advanced wastewater treatment, wetland restoration and other management actions.
The area of urban and suburban lands in coastal watersheds—Population growth and urban sprawl impinge on natural habitats, affecting wildlife and leading to increased water pollution. Tracking the extent of urban lands will help planners and managers make decisions on issues ranging from zoning restrictions to riparian protection to wastewater management.
Indicators used in the Gulf of Maine
Some recent projects have developed sets of environmental indicators for nationwide patterns and trends; however, nationwide environmental indicators are not always relevant to our local concerns in the Gulf of Maine. Just as my grandfather thinks deeply about what is real and what is changing within his sphere of experience, environmental scientists, managers and politicians around the Gulf must think deeply about these things within the region.
Some local groups have developed ‘state of the environment’ reports for areas within the Gulf of Maine—including the Casco Bay Estuary Program, New Hampshire Estuary Project (NHEP) and the Conservation Council of New Brunswick. The NHEP, part of the U.S. Environmental Protection Agency’s National Estuary Program, has recently produced the State of the Estuaries 2003 report. The report details 12 environmental indicators tracked by NHEP, such as bacteria levels, nitrogen concentrations, abundance of shellfish and land use in the coastal watershed. The report includes management goals, explanations of supporting data and ongoing efforts to achieve management goals.
One of the indicators in the NHEP report was based on the question: How much of New Hampshire’s coastal watershed is covered by impervious surfaces? Impervious surfaces are areas like paved parking lots, roadways and building roofs that increase the amount of surface water—which may carry pollutants—that flows into streams, ponds and other bodies of water. Some studies have shown that when more than 10 percent of a watershed is covered by impervious surfaces, water quality in nearby water bodies becomes impaired. Using advanced mapping technology and satellite imagery, researchers determined that 11 of 42 towns in the coastal watershed had more than ten percent coverage of impervious surfaces, the highest being New Castle, with 30 percent. Furthermore, over 11,000 acres of impervious surface were added to coastal watersheds from 1990 to 2000. This indicator provides important information for land planning and resource management in New Hampshire.
The Summit: Building future indicators
Efforts are underway to develop Gulf-wide environmental indicators. In December 2002, more than 100 representatives of government agencies, academia and non-government organizations met in New Hampshire for the Atlantic Northeast Coastal Monitoring Summit, which explored the potential for integrated regional monitoring and provided participants with a forum to discuss possible indicators. As a follow-up, the Northeast Coastal Indicators Workshop planned for January 2004 [see Calendar, page eleven] will develop regional indicators for six categories: fisheries, eutrophication, contaminants, land use, aquatic habitat and climate change. The meeting is being organized, and will be attended by, representatives from six northeast states, two Canadian provinces, and five U.S. and Canadian federal agencies.
Regional efforts will culminate in the Gulf of Maine Summit (www.gulfofmainesummit.org) in the fall of 2004. The purpose of the summit is to formally adopt environmental indicators and begin to evaluate and respond to regional environmental problems. The Summit will set the stage for the preparation of a State of the Gulf of Maine report that will serve many purposes:
- Provide structure for an integrated monitoring program
- Identify information gaps
- Identify problem areas and research needs
- Compile information on standard protocols and quality assurance
- Help inform and engage the public on environmental issues
- Advocate for enhanced science, policy-making and management
The report will also help connect the various jurisdictions and organizations around the Gulf of Maine and allow people to see their own areas and issues as part of the larger Gulf of Maine ecosystem.
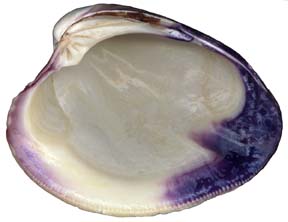 |
| Many of the Gulf of Maine's shellfish, such as the quahog, are both ecologically and economically important. Measures of the abundance and health of these animals are often used as environmental indicators. Photo: Ethan Nedeau |
The value of a robust set of environmental indicators, compilation of key monitoring information and a State of the Gulf report is almost beyond measure. Imagine if scientists and managers from decades or centuries ago could have put together a similar effort? Yet, we are often only left with anecdotes about the way things were. When I visit my grandfather, I find myself listening with a heavy heart to the passion that he expresses for his village that was once...familiar; his anecdotes are as filling as the Thanksgiving turkey. Environmental indicators are less poetic and expressive than Henry; they tend to be quantitative and unbiased, presented as cold charts or data tables. Yet, environmental indicators will enable us to document the health and status of our natural ecosystems. We will benefit by having sound science behind environmental decision-making and future generations will benefit by having a basis for comparison to evaluate long-term changes in ecosystem health and recovery.
Ethan Nedeau is a science translator for the Gulf of Maine Council. He can be reached at ejnedeau@comcast.net.