
These images are provided for use by newspapers, magazines, Web sites, and newsletters
publishing information about seafloor mapping in the Gulf
of Maine. The images are not copyrighted and may be used
freely, but they must be properly credited as indicated below.
Click on images to see and download high-resolution versions.
Click here for the GOMMI home page.
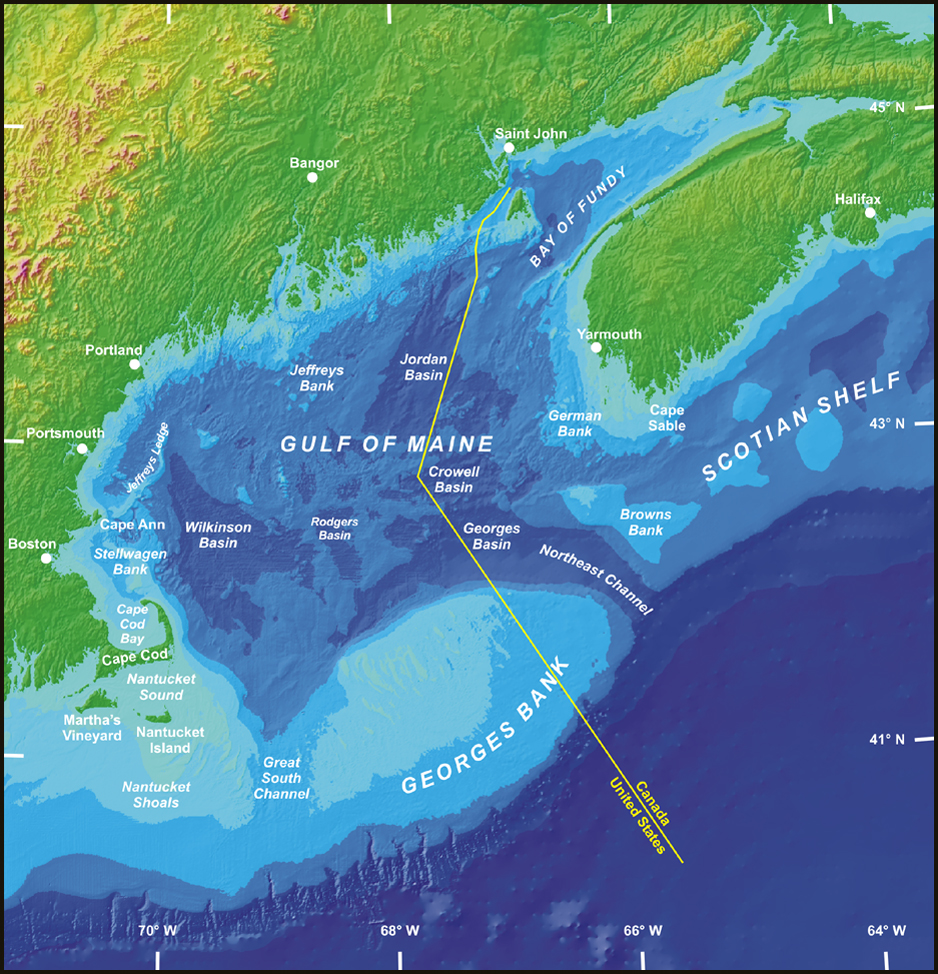 |
Map of the Gulf of Maine region This map shows some major features of the Gulf of Maine region based on existing Credit: Base map courtesy of United States Geological Survey/Geological Survey of Canada/Woods Hole Field |
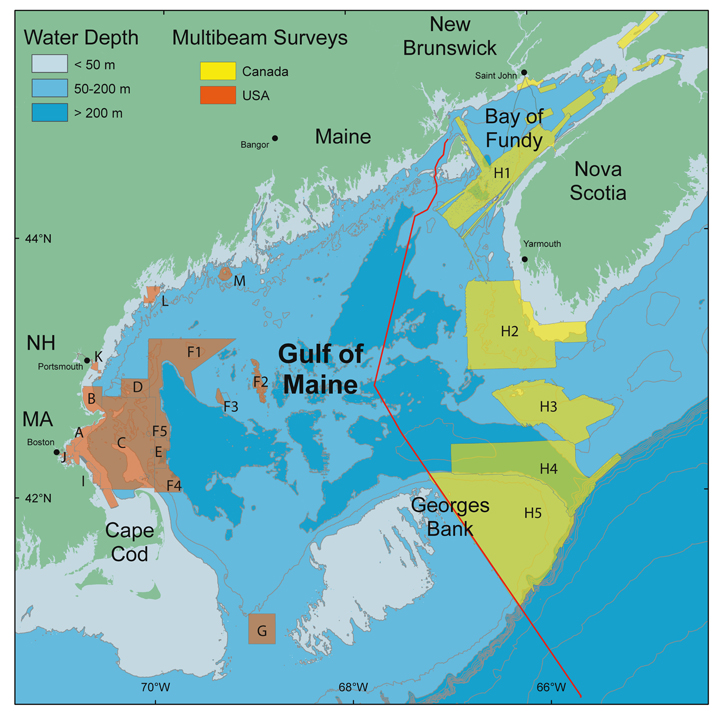 |
Areas mapped using high-resolution bathymetric surveys as of June 2007 Only parts of the Gulf of Maine have been mapped in sufficient detail Interactive map (HTML) Map with list of survey areas and data providers (Word, 762 MB)
Credit: Gulf of Maine Mapping Initiative |
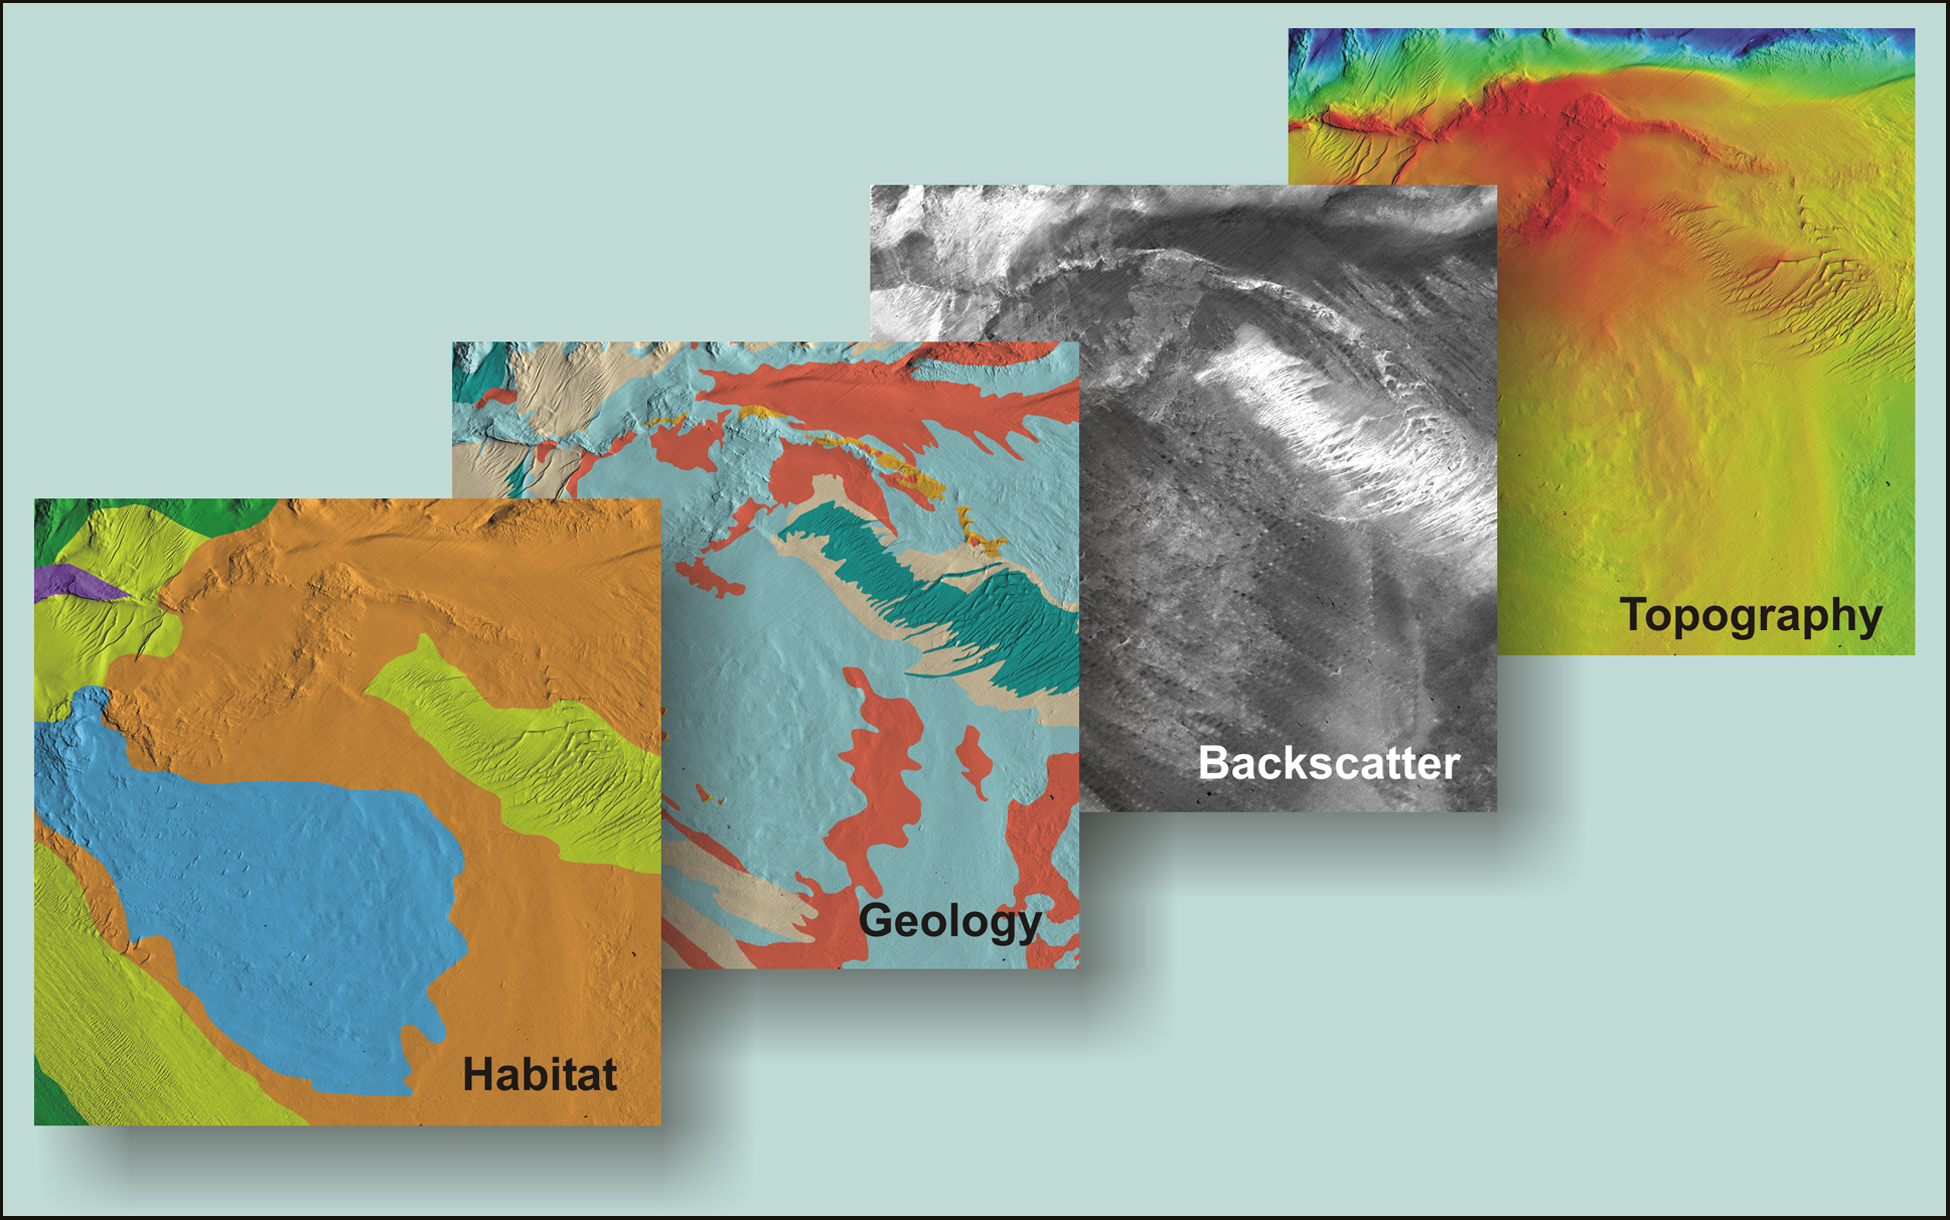 |
Examples of anticipated GOMMI map products Seafloor topography and backscatter maps are
derived from acoustic (multibeam sonar) surveys. Geology and habitat maps are produced by analyzing data from acoustic surveys and groundtruthing. Credit: Geological Survey of Canada (Atlantic) |
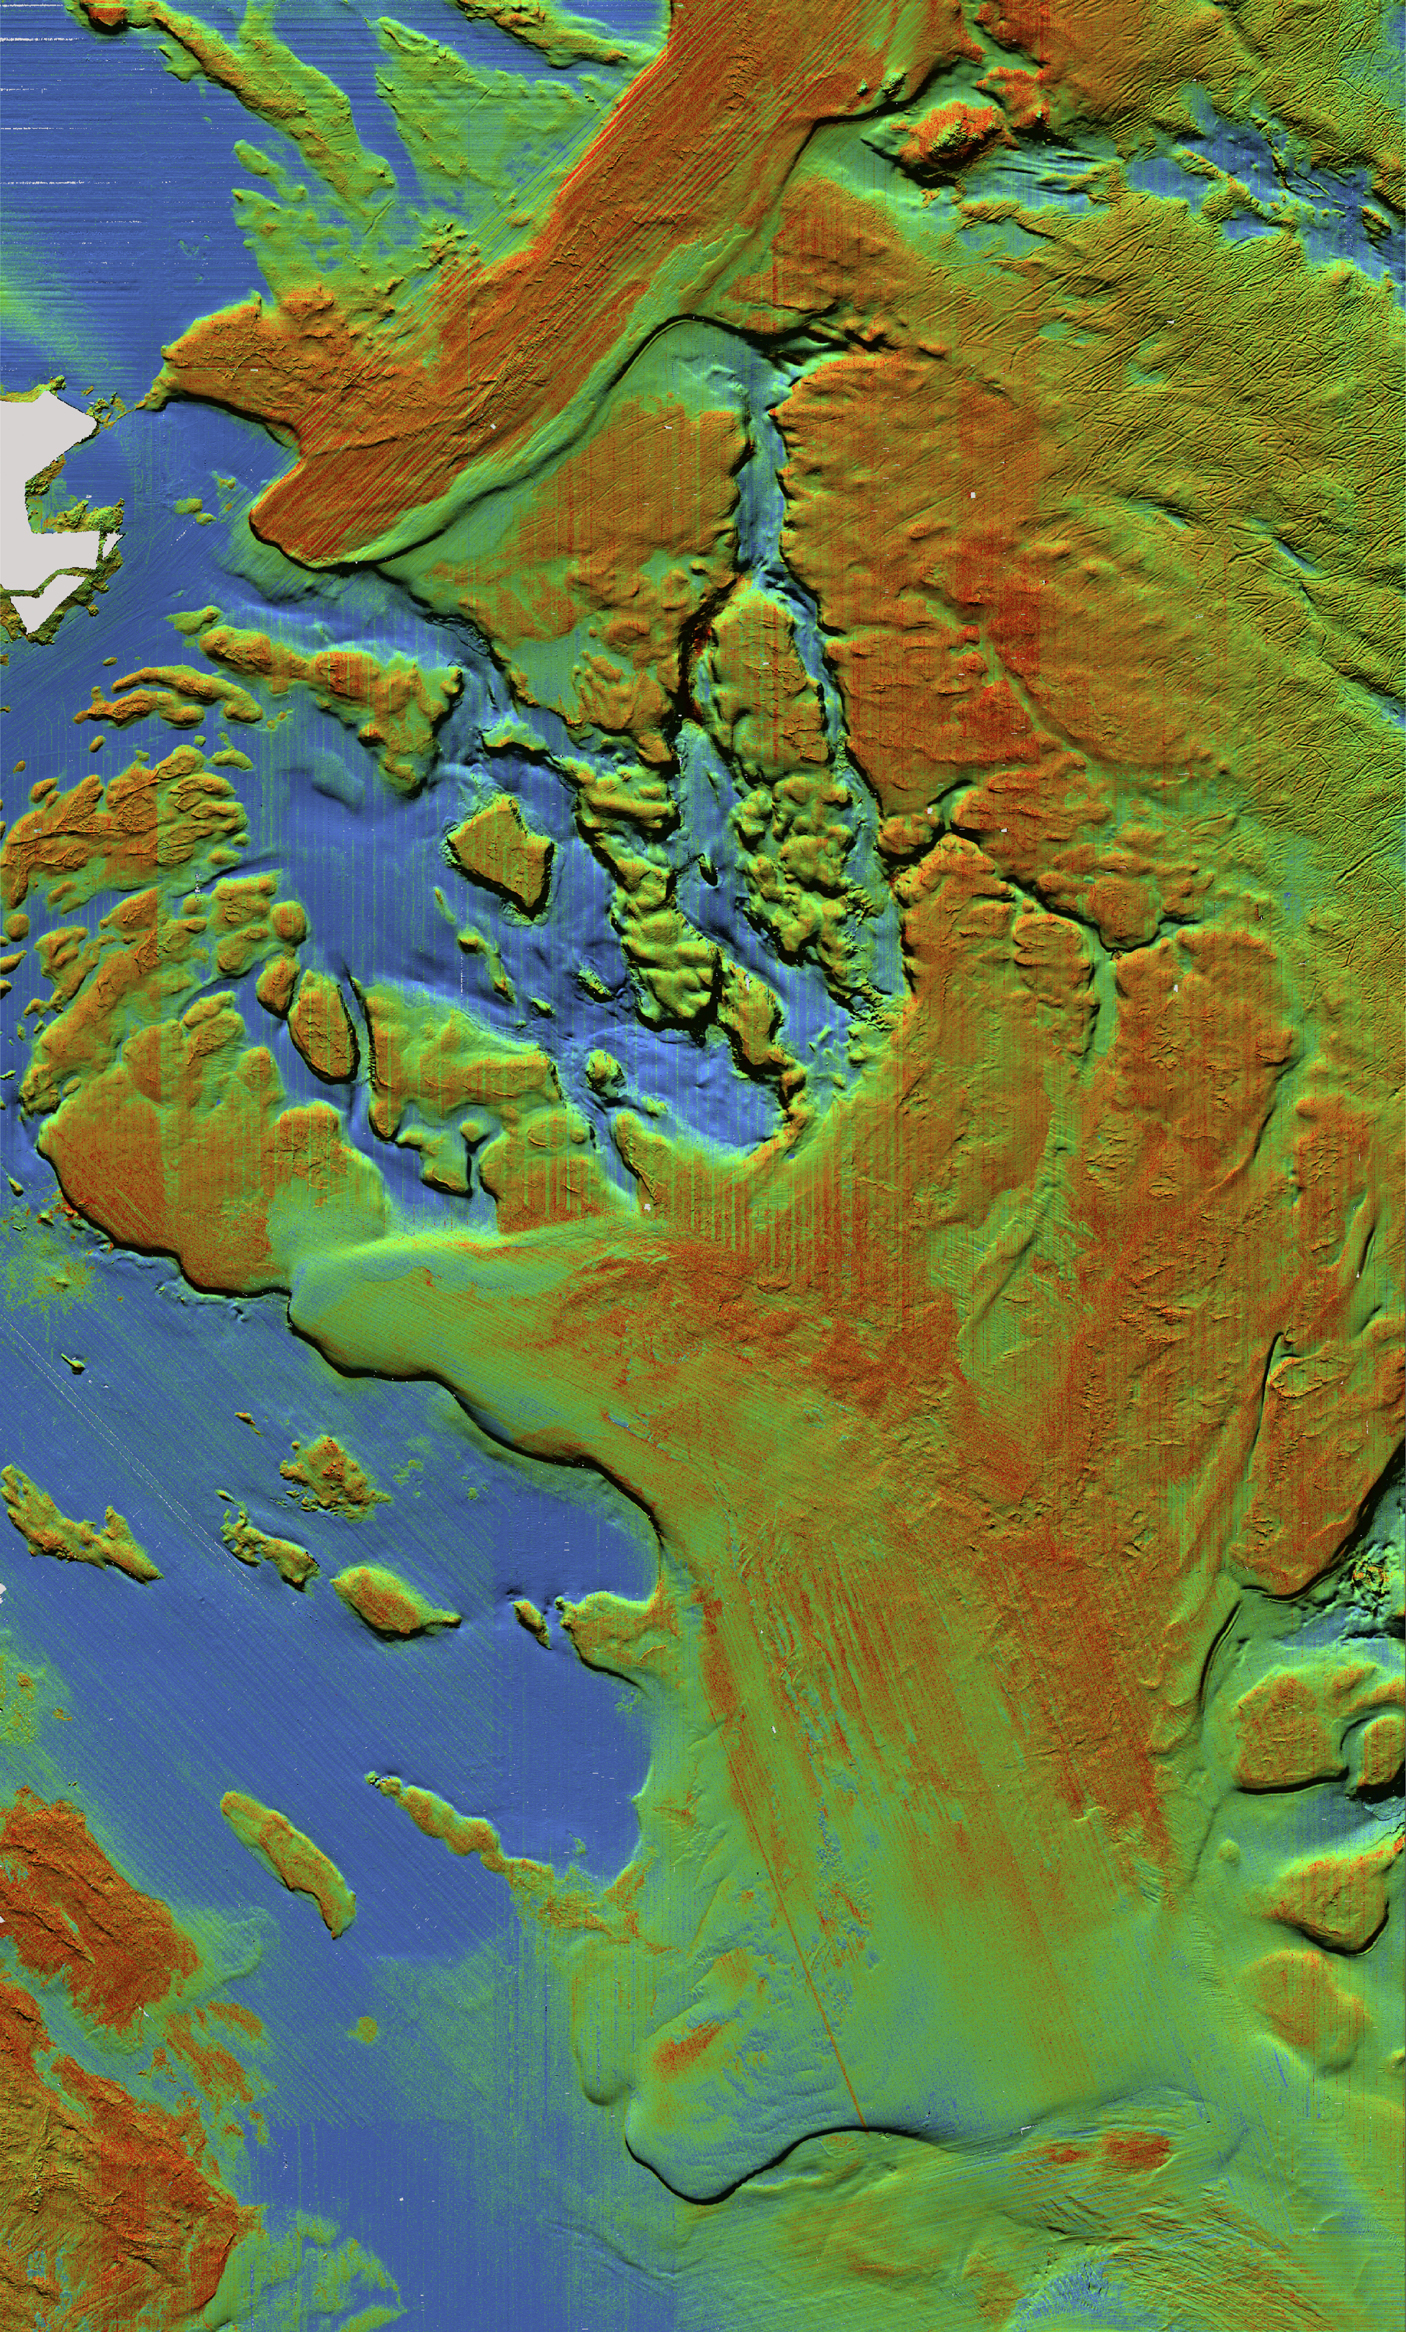 |
Multibeam sonar image of the seafloor This image shows the contours of the seafloor at Stellwagen Bank in Massachusetts
Bay based on data from multibeam sonar. The colors indicate hardness and roughness of the substrate. Red and orange indicate coarse sand or rock. Green denotes sand or muddy sand. Blue means mud or sandy mud. Data from multibeam surveys can be combined with data from biological sampling to produce habitat maps. Credit: United States Geological Survey |
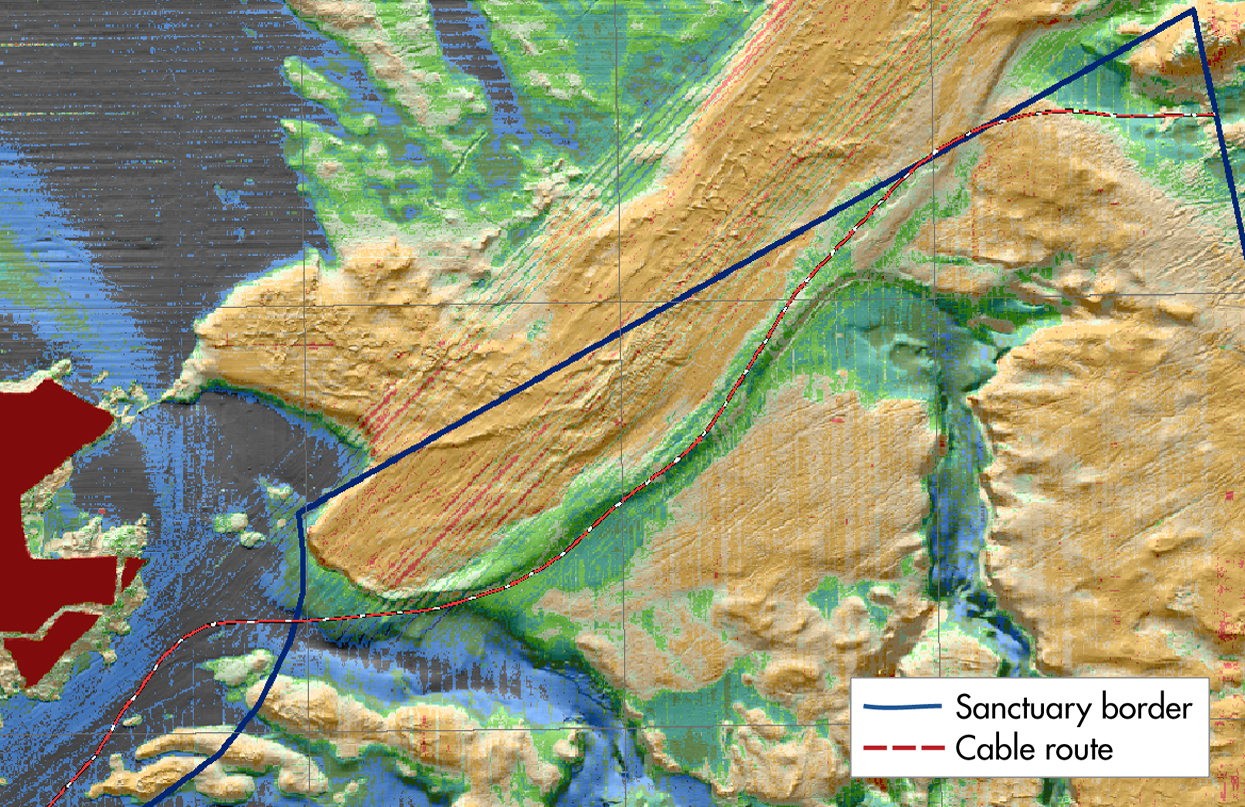 |
Minimizing ecological and financial costs of routing a fiber-optic Between 1994 and 1996, the National Marine Sanctuary Program worked with the
U.S. Geological Survey to map Stellwagen Bank National Marine Sanctuary and portions of western Massachusetts Bay. Scientists collected multibeam sonar data on bathymetry and substrate, which they ground-truthed with video, photography, and sediment samples. The maps cover 3,900 square kilometers and provide important information for management and research activities. When a private company needed to place a fiber-optic cable through the Sanctuary in 2000, they used the maps to route it across areas of soft sediment, avoiding hard gravel bottom where the cable could not be buried for its protection. Normally, extensive bottom sampling would have been required, increasing both project costs and ecological impacts on seafloor habitats. Credit: Stellwagen Bank National Marine Sanctuary |